This report analyzes Palantir (PLTR), highlighting its government-led revenue, growing consumer segment, and strong financials. Government deals offer stability but carry political risk, while consumer growth aids diversification. Despite solid cash flow, TAM uncertainty clouds long-term projections. A DCF model with mean CAGR yields a $90 price target. The stock is rated “hold” due to balanced strengths and uncertainties.
Company Overview
Palantir Technologies Inc. builds and deploys software platforms for the intelligence community to assist in counterterrorism investigations and operations in the United States, the United Kingdom, and internationally.
It provides Palantir Gotham, a software platform, which enables users to identify patterns hidden deep within datasets, ranging from signals intelligence sources to reports from confidential informants, as well as facilitates the hand-off between analysts and operational users, helping operators plan and execute real-world responses to threats that have been identified within the platform.
The company also offers Palantir Foundry, a platform that transforms the ways organizations operate by creating a central operating system for their data; and allows individual users to integrate and analyze the data they need in one place.
In addition, it provides Palantir Apollo, a software that delivers software and updates across the business, as well as enables customers to deploy their software virtually in any environment; and Palantir Artificial Intelligence Platform that provides unified access to open-source, self-hosted, and commercial large language models (LLMs) that can transform structured and unstructured data into LLM-understandable objects and can turn organizations’ actions and processes into tools for humans and LLM-driven agents.
The company was incorporated in 2003 and is headquartered in Denver, Colorado.
Executive Summary
This research report provides an in-depth analysis of Palantir Technologies Inc. (PLTR), focusing on key aspects such as revenue breakdown, growth trends, and financial performance. Palantir primarily generates revenue from two main segments: government and consumer. The government sector remains the dominant source, with high-value contracts from federal and local government agencies, but its growth is subject to political and policy changes, making it a high-risk area. On the other hand, the consumer sector, while smaller, has been showing strong growth, with increasing demand from private enterprises looking to leverage Palantir’s data analytics solutions. The company’s ability to expand its consumer base is crucial for future diversification and growth.
The report also examines the characteristics of Palantir’s government deals, which often involve long-term contracts with substantial value. These deals provide a stable revenue stream but are heavily influenced by shifting political priorities and government budgets, presenting an element of unpredictability. Meanwhile, the consumer sector faces a more competitive landscape, but Palantir’s proprietary software and unique value proposition allow it to maintain a competitive edge.
In terms of financial performance, Palantir demonstrates a solid financial foundation, with strong cash flow generation and profitability. However, the company’s growth trajectory remains difficult to predict due to the challenges in estimating the Total Addressable Market (TAM), which is integral to long-term revenue projections. A Discounted Cash Flow (DCF) analysis using the mean Compound Annual Growth Rate (CAGR) suggests a price target of $90 for Palantir.
Given the current macroeconomic instability and the inherent risks associated with government contracts, the report recommends a “hold” rating. This reflects the cautious stance toward the stock, factoring in both the company’s solid fundamentals and the unpredictable external factors affecting its future growth.
Revenue Breakdown
Palantir reports its revenue in two segments: Government and Commercial. The table below summarizes each segment’s revenue from 2019 through 2024, along with the segment’s percentage of Palantir’s total revenue and year-over-year (YoY) growth.
| Year | Segment | Revenue (USD millions) | % of Total Revenue | YoY Growth |
|---|---|---|---|---|
| 2024 | Government | $1,570 million | 55% | +28% |
| Commercial | $1,296 million | 45% | +29% | |
| 2023 | Government | $1,222 million | 55% | +14% |
| Commercial | $1,003 million | 45% | +20% | |
| 2022 | Government | $1,072 million | 56% | +20% |
| Commercial | $834 million | 44% | +29% | |
| 2021 | Government | $897 million | 58% | +47% |
| Commercial | $645 million | 42% | +34% | |
| 2020 | Government | $610 million | 56% | +76% |
| Commercial | $482 million | 44% | +21% | |
| 2019 | Government | $346 million | 46.5% | – |
| Commercial | $397 million | 53.5% | – |
As shown above, Palantir’s Government segment contributed 55% of total revenue in 2024, while the Commercial segment contributed 45% . This split has remained near the mid-50s for government vs mid-40s for commercial in recent years. Notably, in 2021 the government business peaked at about 58% of total revenue , reflecting Palantir’s deep roots in government contracts. Earlier years are not officially broken out by segment, but Palantir was historically known for its government work and only began expanding more significantly into commercial markets around 2016–2018.
Product/Service by Segment
Palantir’s platforms are generally applicable across both segments, but certain products have historically been associated with either government or commercial use cases. The table below maps Palantir’s key products to the segment where they are primarily used or marketed, along with a brief description of each product’s function (as described in official disclosures):
| Segment | Product/Service | Description / Function |
|---|---|---|
| Government | Palantir Gotham | An AI-ready operating system for defense and intelligence operations. Enables users (e.g. military, intelligence analysts) to integrate and analyze disparate data to identify hidden patterns and respond to threats. Used broadly across government functions. Gotham was Palantir’s first platform, originally designed for U.S. national security and counterterrorism analytics. |
| Government | Palantir Apollo | A continuous delivery and deployment system that manages and updates Palantir software in any environment (cloud, on-premises, classified networks). Ensures critical systems (like Gotham) receive updates and run reliably even in secure or isolated government IT environments. (Apollo was introduced as a commercial offering in 2021, but it underpins both segments by allowing software to run in virtually any infrastructure.) |
| Government | Palantir AIP | The Artificial Intelligence Platform, introduced in 2023, which integrates advanced AI (including large language models) into Palantir’s software. AIP allows government users to leverage generative AI on sensitive data within Gotham/Foundry while respecting legal, ethical, and security constraints. This is used to help defense and public sector customers operationalize AI for decisions (e.g., military planning, intelligence analysis). |
| Commercial | Palantir Foundry | An enterprise data integration and analytics platform used by commercial industries. Foundry acts as a central operating system for an organization’s data – allowing business users, analysts, and data scientists to clean, integrate, and analyze large volumes of data in one place. It enables faster experimentation and decision-making in sectors like finance, healthcare, energy, and others. (All Palantir’s commercial customers use Foundry, and some government customers use it as well.) |
| Commercial | Palantir Apollo | (Same platform as above.) Apollo supports commercial clients by automating software delivery and maintenance across cloud or on-premises environments. For example, a commercial customer can deploy Foundry in their private cloud or edge devices with Apollo handling updates, ensuring minimal downtime. This is crucial for industries with hybrid IT setups. |
| Commercial | Palantir AIP | (Same platform as above.) AIP allows Palantir’s commercial clients to embed AI and large language models into their operations. It enables enterprises to derive insights from their proprietary data using AI, within Foundry’s ecosystem. For instance, a manufacturing company can leverage AIP to optimize supply chain decisions with AI, using Foundry’s data foundation but without compromising data security or privacy. |
Palantir’s Gotham and Foundry platforms form the core of its government and commercial offerings, respectively. Gotham was originally created for government intelligence and defense use, helping agencies fuse complex datasets and drive mission-critical decisions. Foundry was later developed (launched in 2016) to bring similar data integration capabilities to commercial enterprises, enabling them to operate from a central data platform. Supporting these, Apollo serves as the backbone for software deployment in both segments – it allows Palantir’s applications to run in diverse environments and receive continuous updates, which is particularly important for government clients with air-gapped networks as well as businesses with hybrid cloud setups. The newest addition, AIP (Artificial Intelligence Platform), spans both segments as well, injecting Palantir’s solutions with advanced AI and large-language models. AIP is designed to let users in either segment leverage AI on their secure data – whether it’s a military analyst using AI-assisted decision tools or a company applying AI to business data – all within Palantir’s governed platforms. Each product complements Palantir’s strategy of offering integrated, out-of-the-box software that can be adapted to solve complex data problems in both the public and private sectors.
Government Segment Revenue
The table below details the Government segment’s revenue from 2019 through 2024, along with YoY growth and its share of Palantir’s total revenue each year:
| Year | Gov. Revenue (USD M) | YoY Growth | Share of Total |
|---|---|---|---|
| 2024 | $1,570 | +28% | 55% |
| 2023 | $1,222 | +14% | 55% |
| 2022 | $1,072 | +20% | 56% |
| 2021 | $897 | +47% | 58% |
| 2020 | $610 | +76% | 56% |
| 2019 | $346 | – | 46.5% |
The government segment has grown substantially over the past several years. Revenue from government customers more than quadrupled from around $346 million in 2019 to $1.57 billion in 2024, making it the larger of Palantir’s two segments in every year of public reporting. The most dramatic jump occurred in 2020, where government revenue rose ~76% year-over-year, reflecting major new contracts (for example, expanded U.S. government deals during the COVID-19 response period). Growth remained high at +47% in 2021, with government revenue reaching $897 million. This growth led the government division to comprise 58% of total revenue in 2021, its highest share in the period.
After 2021, growth in government revenue slowed to about +20% in 2022, then only +14% in 2023. Despite this deceleration (likely as large defense and public-sector contracts were fully ramped up or timing of new deals moderated), 2023 government revenue still hit $1.22 billion. Notably, 2024 saw an acceleration back to +28% growth for the government segment, bringing it to $1.57 billion. This resurgence suggests a significant uptick in governmental demand or deployments in 2024, and government clients continued to account for 55% of Palantir’s total sales in 2024. Overall, the data shows the government segment’s revenue trajectory has been upward, with inflection points around 2020–2021 (rapid expansion) and a renewed growth push in 2024. Even in years of slower growth, the government business delivered steady increases and remained a core revenue driver for Palantir.
Major Government Contracts
| Deal Name | Timing | Summary | Revenue Generated | Source Citation | Market Response |
|---|---|---|---|---|---|
| NHS England – COVID-19 Data Store | 2020-Dec | Two-year agreement for Palantir’s Foundry platform to power NHS England’s COVID-19 data store, enabling pandemic data management, resource allocation, and vaccine rollout planning. | £23.5 M (≈$31 M) | Palantir Continues Vital NHS Work With $31.5M Contract | Palantir shares little changed on announcement, but the deal secured a foothold in UK healthcare post-IPO. |
| USSOCOM – Mission Command Platform | 2021-May | Contract to serve as U.S. Special Operations Command’s enterprise data management and AI-enabled mission command platform. Palantir’s tech provides special forces with real-time mission planning, situational awareness, and operational intelligence. | $111 M (2-year) | Palantir Awarded $111m Contract to Provide Mission Command Platform for the United States Special Operations Command | Stock jumped ~14% around announcement (mid-$21 to ~$24) as investors welcomed Palantir’s contract renewal. |
| U.S. Army – DCGS-A Data Fabric (Cap Drop 2) | 2021-Oct | Award to build the Army’s “data fabric” for its Distributed Common Ground System (intelligence platform). Palantir’s Gotham software will integrate global intel data, modernizing battlefield analytics and decision-making for multi-domain operations. | $823 M (multi-year IDIQ) | Army Awards Palantir $823M Contract For Enterprise ‘Data Fabric’ – Breaking Defense | Palantir stock surged 10–15% on the announcement, though it pared gains by next day (Oct 6, 2021). |
| U.S. CDC – Disease Surveillance COP | 2022-Dec | Five-year deal consolidating Palantir’s pandemic-era systems (HHS Protect, Tiberius, etc.) into a unified “Common Operating Picture” for disease surveillance. Supports CDC’s long-term outbreak response beyond COVID-19 (e.g. monkeypox, RSV). | $443 M (5-year) | CDC awards Palantir consolidated disease surveillance contract worth $443M | Shares rose ~5% in the days after announcement, as the contract bolstered Palantir’s government backlog. |
| UK Ministry of Defence – Enterprise Deal | 2022-Dec | Three-year enterprise agreement to deploy Palantir software across UK defense. Expands a prior Royal Navy pilot into ministry-wide adoption for operations and intelligence, leveraging Palantir’s AI to improve decision-making amid heightened focus from the Ukraine conflict. | £75 M (≈$91 M) | Palantir lands 75 million pound deal with British military | Stock ticked up ~3% on Dec 21, 2022, a modest boost as investors saw continued international defense traction. |
| U.S. Air Force – Data Platform Contracts | 2023-Jun | Multiple awards providing Palantir’s data-as-a-service platforms for the U.S. Air and Space Forces. Includes an HQ data integration system and a space situational awareness platform for Space Command centers (NSDC and CSpOC). | ~$110 M (combined) | Palantir racks up more than $100M in new Air Force contract awards to provide data-as-a-service | No significant immediate stock move; news was anticipated as Palantir deepened its Air/Space Force engagement. |
| U.S. Army – AI/ML Research Contract | 2023-Sep | Contract (through 2026) for up to $250M to research and experiment with artificial intelligence and machine learning for the Army. Funds development of AI models for battlefield applications, reflecting DoD’s growing investment in advanced analytics. | $250 M (ceiling) | Palantir wins $250 million US Army AI research contract) | Little immediate boost; shares were flat-to-down amid broader market weakness, despite the strategic AI focus. |
| NHS England – Federated Data Platform | 2023-Nov | Seven-year project to develop the NHS Federated Data Platform, integrating patient data across the UK health system. Aims to tackle care backlogs and improve coordination, with Palantir leading a consortium to deliver this nationwide health data infrastructure. | £330 M (≈$412 M) | UK’s NHS hands U.S.-based Palantir contract for patient data software | Stock fell ~6% on announcement (Nov 21, 2023) as contract value came in at the low end of expectations, though it recovered later. |
| U.S. Army – Vantage Recompete (Data Platform) | 2024-Dec | Follow-on contract to continue Palantir’s Army Vantage analytics platform (now Army’s core data platform). One-year base plus multiple option periods (potential ~$619M total) to provide a SaaS data backbone for Army-wide readiness and operations. | $400.7 M (base award; ~$619 M max) | Palantir Secures $401M Follow-On Army Vantage Support Contract – GovCon Wire | Stock gained ~3% on Dec 18, 2024 and continued upward into year-end, reflecting confidence in Palantir’s renewal. |
Individual Deal Analysis
NHS England (COVID-19 Data Store), Dec 2020
This £23.5 million two-year contract had modest direct financial impact (under 5% of annual revenue) but was strategically significant. It extended Palantir’s role in the NHS beyond an emergency pilot, ensuring continued revenue from the UK public sector. Investor reaction was muted, as the deal’s size was relatively small, but it demonstrated Palantir’s ability to secure renewal business overseas. Strategically, this win cemented Palantir’s credibility in healthcare, laying the groundwork for larger NHS projects to follow.
U.S. Special Operations Command (Mission Command), May 2021
Valued at $111 million over two years, this contract helped sustain Palantir’s government revenue growth (roughly ~7% of 2021 revenues). It was a recompete that Palantir won, underscoring strong customer retention. The stock jumped sharply (~14% gain around announcement) as investors saw affirmation of Palantir’s role in defense programs. Management highlighted on earnings calls that such renewals support margins through recurring software licensing. Strategically, the USSOCOM deal was pivotal – it was one of Palantir’s earliest military clients and its extension signaled trust in Palantir’s platform for mission-critical operations.
U.S. Army – DCGS-A Data Fabric, Oct 2021
This seven-year $823 million award (Palantir’s largest post-IPO contract) materially boosted the company’s backlog and long-term government revenue outlook. Investors reacted very positively – Palantir’s stock spiked in double digits on the news – reflecting the deal’s scale and validation of Palantir’s technology over incumbents. In earnings commentary, executives noted this contract would meaningfully contribute to annual government segment growth once fully ramped. Strategically, winning the Army’s Distributed Common Ground System modernization (beating a defense prime) was a watershed moment, positioning Palantir as a core Army partner and opening the door for follow-on work in battlefield intelligence systems.
U.S. CDC – Disease Surveillance “Common Operating Picture,” Dec 2022
This $443 million five-year deal consolidated several existing public health contracts into one, securing and slightly expanding Palantir’s work with U.S. health agencies. The immediate revenue impact was to stabilize government growth – essentially locking in multi-year software subscription fees that Palantir had been earning through COVID-response contracts. The market viewed it as a positive, though not transformative, development; Palantir’s stock rose modestly (~5% over the week) as it signaled successful transition of pandemic-era programs into long-term business. Strategically, the CDC contract is significant as it entrenches Palantir in federal health infrastructure (beyond the emergency phase) and could yield high-margin recurring revenue while showcasing Palantir’s role in national preparedness.
UK Ministry of Defence – Enterprise Agreement, Dec 2022
Palantir’s £75 million (~$91 M) deal with the UK MoD, spread over three years, contributed to international revenue growth (the UK became ~10% of Palantir’s total sales). The stock had a mild uptick on the announcement, but the broader 2022 market downturn muted any major rally. Financially, this contract adds a steady mid-sized stream of revenue; given Palantir’s high software gross margins, even a ~$30M/year deal supports earnings. More importantly, it signaled strategic expansion: Palantir is now a core platform across the British armed forces, not just a pilot project. This deepens Palantir’s NATO-aligned defense portfolio and could lead to additional modules or renewals. It also highlighted Palantir’s relevance in the context of the Ukraine war, as allied militaries invest in data-driven systems.
U.S. Air Force / Space Force Data Platforms, June 2023
Palantir secured a set of Air Force contracts totaling around $110 million to provide data integration and analytics platforms for Air Force Headquarters, Space Force’s operations centers, and NORAD/NORTHCOM. While individually smaller, collectively they represented a significant expansion in the DoD’s use of Palantir beyond Army and Special Forces. The financial impact was additive but not game-changing – these contracts likely contributed a few percentage points to 2023 government revenue. Investor reaction was neutral; the stock did not move significantly on these specific awards, as they were expected in light of Palantir’s prior work with Space Command. Strategically, however, the deals are meaningful: they established Palantir in the Air Force and Space Force as an enterprise provider, paving the way for potential larger programs.
U.S. Army – AI/ML Research Contract, Sep 2023
This contract, worth up to $250 million through 2026, is structured as an IDIQ for AI R&D services. The revenue contribution will depend on task orders, but it underscored Palantir’s role in cutting-edge defense technology. The stock market response was subdued (Palantir’s share price saw no notable jump on the news, amid a broader late-September tech selloff). However, on the Q3 2023 earnings call, management highlighted it as evidence of Palantir’s leadership in operational AI and potential to drive future growth. Strategically, the Army AI award is significant in that it positions Palantir at the heart of the Pentagon’s AI modernization efforts – a signal that its platforms are trusted not just for data aggregation but also for developing and fielding AI models for warfighting.
NHS England – Federated Data Platform, Nov 2023
This high-profile £330 million (~$412 M) contract (over seven years) is one of Palantir’s largest international wins. Financially, it promises a stable long-term revenue stream (roughly $50–60M annually at full ramp) and significantly boosts the company’s U.K. segment. Interestingly, the stock fell about 6% on the day of announcement – investors had anticipated a potentially larger award (the contract’s maximum value was touted up to £480M), so the confirmed size tempered near-term enthusiasm. Some analysts also noted the long timeline means revenue recognition will be gradual. Strategically, however, this deal is a cornerstone for Palantir: it solidifies their position in global healthcare IT and could lead to expansion into other national health systems if successfully delivered. It also vindicated Palantir’s decision to persist in the NHS despite political scrutiny. In the long run, management sees it as a validation that Foundry can be the backbone of large-scale health data infrastructure.
U.S. Army – Vantage Recompete, Dec 2024
Palantir’s year-end 2024 award for Army Vantage (the Army’s analytics platform) – $400.7 million with options up to $619 million – secured one of its key existing programs for several more years. This had a favorable financial impact: it prevented a potential revenue gap from Vantage’s prior contract expiration and ensured continuity of a high-margin SaaS contract. The stock reacted positively (up a few percent on the day and continuing to trend upward as part of Palantir’s strong 2024 finish) as investors gained confidence that Palantir can not only win new deals but also hold onto major ones in recompetes. Executives likely emphasized on calls that this deal would contribute to stable government revenue growth into 2025–2026 and help maintain Palantir’s adjusted operating margins, given the software reusability. Strategically, retaining Army Vantage was crucial – it affirmed Palantir’s status as an incumbent platform that the Army depends on for readiness and data-driven decision support. It also demonstrated that even in the face of competition or “build vs buy” debates, Palantir’s value proposition for enterprise data platforms in defense remains strong .
Commercial Segment Revenue
The table below shows the Commercial segment’s revenue for 2019–2024, with YoY growth and share of total revenue:
| Year | Comm. Revenue (USD M) | YoY Growth | Share of Total |
|---|---|---|---|
| 2024 | $1,296 ([Palantir Revenue Breakdown: Government Vs Commercial | +29% | 45% |
| 2023 | $1,003 | +20% | 45% |
| 2022 | $834 | +29% | 44% |
| 2021 | $645 | +34% | 42% |
| 2020 | $482 | +21% | 44% |
| 2019 | $397 | – | 53.5% |
Palantir’s commercial segment has exhibited steady and at times rapid growth, especially as the company broadened its focus beyond government clients. Commercial revenue expanded from roughly $397 million in 2019 to $1.30 billion in 2024, essentially tripling over five years. Year-over-year growth was robust in 2021 at +34%, as commercial sales reached $645 million with wider adoption of Palantir Foundry across industries. Growth then moderated to +29% in 2022 (commercial revenue $834 million) and further to about +20% in 2023, when commercial customers contributed $1.00 billion. Despite the slowdown in 2023, the commercial segment still outpaced the government segment’s growth that year, and its share of total revenue ticked up to 45% from 42% in 2021.
In 2024, commercial revenue re-accelerated to +29% (adding roughly $293 million year-on-year), bringing it to $1.296 billion. This was on par with the government segment’s growth rate in 2024, and kept the commercial share of total revenue at 45%. Over the longer term, the commercial business has grown at a slightly higher compound rate than the government side. For example, from 2021 to 2024, commercial segment revenue doubled (approximately +100%), compared to about +75% growth in government segment revenue over the same period. This reflects Palantir’s strategic push into enterprise and industrial sectors in recent years, leveraging its Foundry platform to penetrate new verticals. It’s also notable that the commercial segment was smaller than government until 2019, but has since remained roughly 40–45% of the company’s sales, indicating that while commercial revenue is growing rapidly, the government segment has also expanded in parallel, maintaining a lead in absolute dollars. In summary, the commercial segment’s data shows strong growth momentum and an increasing contribution to Palantir’s overall revenue mix, even though it currently remains slightly behind government in share of revenue.
Economic Moat
Companies like AWS, Snowflake, and ServiceNow offer data analytics tools, but Palantir distinguishes itself by providing an AI-powered ontology framework that integrates disparate datasets, identifying hidden yet crucial data relationships to facilitate optimized decision-making. Unlike traditional internal IT departments that often rely on fragmented and costly-to-scale patchwork solutions, Palantir builds an intuitive, comprehensive, and continuously improving feedback loop. This structure enables seamless connectivity across organizational functions, significantly enhancing analytical precision and usability.
Palantir collects diverse customer data types, including structured datasets (organized in tables), unstructured information (emails, logs, videos), intelligence records (satellite imagery, threat assessments), operational metrics (supply chains, production data), and analog inputs (physical parameters like temperature or vibration). The platform efficiently cleanses this information, applies advanced machine learning algorithms, and generates actionable, prioritized insights directly applicable to daily operations.
In 2023, Palantir introduced its upsell Artificial Intelligence Platform (AIP), which leverages large language model orchestration, significantly lowering technical barriers for nontechnical users. Palantir’s ontology not only consolidates and visualizes complex data but also prioritizes and ranks it, presenting insights that users can swiftly understand and utilize. This results in tangible efficiency improvements across all operational roles, from healthcare—where patient data optimizes bed turnover—to manufacturing, where analog sensor data informs productivity enhancements.
The cumulative efficiency gains offered by Palantir generate substantial switching costs. Abandoning Palantir’s ontology system would mean reverting to outdated, inefficient frameworks and losing critical productivity improvements. The dynamic, continually updating dashboard provided by Palantir ensures that customers maintain their competitive edge, making renewal virtually indispensable for sustained operational effectiveness.
Let’s dive into a widely accepted metric—Net Revenue Retention (NRR)—to analyze and quantify Palantir’s switching costs and customer retention capabilities. NRR serves as a strong indicator of how well a company retains and grows revenue from its existing customer base. At first glance, Palantir does not top the list in this area; competitors like Snowflake report higher NRR figures, which may suggest stronger customer retention. However, a lower NRR doesn’t necessarily mean Palantir is underperforming. Instead, it reflects the structural differences in its business model. While Snowflake scales revenue rapidly through widespread cloud data services across thousands of smaller clients, Palantir works with fewer but significantly larger and more complex enterprise and government contracts. Digging deeper, key metrics such as average contract value, client expansion cycles, and long-term renewals reveal why Palantir’s NRR may appear lower on paper, even as it maintains strong customer stickiness and high switching costs.
The table below shows the net revenue retention (NRR) for each listed company in fiscal years 2021 though 2024.
| Company | FY2021 | FY2022 | FY2023 | FY2024 |
|---|---|---|---|---|
| Palantir | 131% | 115% | 108% | 120% |
| Snowflake | 168% | 178% | 158% | 131% |
| AWS (est.) | ~130% | ~125% | ~110% | ~105% |
| ServiceNow | ~125% | 125% | ~125% | ~125% |
| Databricks (est.) | ~150% | ~150% | ~140% | ~140% |
| Datadog | ~150% | 145% | 115% | ~115% |
| Splunk (Cloud DBNRR) | ~130% | 132% | 123% | ~115% |
Notes: AWS (Amazon Web Services) and Databricks do not publicly disclose NRR, so values are approximate estimates based on industry analysis. Splunk reports NRR for its cloud business only (Cloud DBNRR), reflecting the expansion rate of its cloud customers.
Government-Heavy Revenue Mix Limits Upsell Potential
Over Half of Revenue from Government
Palantir has historically derived 50–55% of its revenue from government clients. This high public-sector mix can inherently constrain NRR. Government agencies tend to have fixed budgets and rigid procurement processes, which limit the scope for rapid upsells or usage expansion mid-contract. Palantir’s large government contracts often come with predetermined scopes or ceilings, meaning revenue can’t easily grow beyond the initial award without new approvals. For example, Palantir’s expanded U.S. Army “Vantage” contract is valued at $400.7M over four years with a $618.9M ceiling – any spend beyond the base value requires additional funding authorizations. Such structures cap organic growth in those accounts.
Steady but Slower Growth in Government Accounts
Government customers are extremely “sticky” (low churn) but typically grow at a modest pace. Palantir’s government deals often deliver lumpy, project-based increments rather than the continuous consumption growth seen in cloud software. As Morningstar notes, large government contracts create lumpiness in Palantir’s revenue. In practice this means a big initial implementation (boosting revenue once) followed by relatively flat recurring spend or incremental add-ons. This dynamic pulls down net retention – once a government deployment reaches full capacity, year-over-year spend might only increase by low single-digit percentages (if at all) absent a new contract or expansion phase. In contrast, commercial SaaS customers typically expand usage more freely year to year, contributing to higher NRR for peers.
It’s worth noting that Palantir’s government segment can produce bursts of expansion – for instance, during 2020–21 Palantir saw surging U.S. government growth (74% YoY at one point) which temporarily drove government NRR above 140%. However, those were exceptional ramp-ups on initial programs. Once those programs matured, growth normalized to a lower rate, leaving Palantir’s overall NRR in the ~110% range. In summary, Palantir’s reliance on federal contracts – while providing revenue stability – tends to constrain upsell velocity, unlike the more flexible spending patterns of enterprise clients.
Contract Structure & Renewal Dynamics vs. Peers
Long-Term, Fixed Commitments
Palantir’s contracts (especially government and large enterprises) are often multi-year agreements with defined scopes or usage commitments. The company typically sells its platform on a subscription basis with a set entitlement, and charges for overages beyond that limit. This model means customers lock in a certain usage level for the contract term. Upselling during the term requires either hitting the usage cap (to trigger overage fees) or renegotiating the contract – a slower process. By contrast, peers like Snowflake and Databricks use pure usage-based billing, where customers’ spend automatically rises with increased consumption of the service. Snowflake’s NRR exemplifies this usage-driven expansion: it peaked around 158% in 2021 and was still 126% as of early 2025. In other words, existing Snowflake customers on average grew their spend ~26% in the past year, purely through greater usage. Palantir’s customers, in aggregate, only expand about 8–15% on average, indicating far less “frictionless” growth within the install base.
“Land-and-Expand” vs. Large Upfront Deals
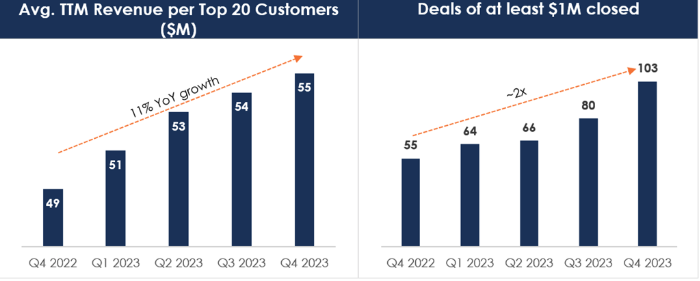
Palantir’s sales approach has traditionally involved very large initial deal sizes (enterprise-wide deployments). The average Palantir customer historically paid ~$5 million per year, and its top 20 customers contribute outsized revenue (~45% of total). This means Palantir often “lands” at scale, leaving less room for exponential expansion thereafter. By contrast, many high-NRR SaaS peers start with smaller deployments and then expand widely. ServiceNow, for example, lands one of its IT workflows in a division, then upsells multiple other modules and additional users across the enterprise, yielding ~125% net retention on a large base. Snowflake often starts with a limited usage trial that can grow 10x as more data and workloads migrate to the platform. Palantir’s big upfront implementations can saturate an organization’s immediate needs, so follow-on growth is more incremental (e.g. adding a new use case or department) rather than doubling spend each year.
Renewal Timing and Flexibility
The timing of contract renewals also affects NRR. Palantir’s multi-year deals often lock in a fixed annual run-rate until renewal. Upsells may happen at renewal (every 2–3+ years) rather than continuously. Peers with more flexible or modular pricing can upsell mid-term. For instance, ServiceNow’s enterprise customers frequently expand subscriptions before the term ends by adding new ServiceNow product lines. Similarly, Snowflake customers consuming beyond their prepaid credit can simply purchase more within the year. Palantir’s model is improving (the company has introduced usage-based pricing options on platforms like AWS Marketplace, but it still leans toward large, predefined deals – especially in government. This difference in contract flexibility means Palantir’s expansion revenue tends to lag behind those of its cloud-native, usage-based peers.
Finally, customer concentration plays a role. With Palantir’s top 20 clients averaging $55M each in annual revenue, any single client’s growth (or stagnation) heavily impacts overall NRR. By having many smaller customers, peers dilute this effect and can rely on a wider base of expansions. In Palantir’s case, if a few large government clients simply renew at flat spending, it weighs down the net retention percentage significantly. Thus, Palantir’s enterprise-heavy portfolio inherently yields a lower blended NRR compared to say, a Snowflake which counts thousands of customers whose usage can independently surge. Few companies can boast NRR above 110% today – Palantir’s ~120% is “slightly below best-in-class peers” like Snowflake (127%) but still healthy for a high-touch enterprise software model. The gap comes down to Palantir’s slower-growing contract base versus the rapid consumption expansion seen in data-cloud peers.
Segment-Level NRR: Government vs. Commercial
Palantir has, on occasion, broken out NRR by segment. In 2021, the company reported exceptionally high retention in both major segments – 146% NRR in its government business and 150% in U.S. commercial – driving a 131% total NRR that year. This indicates that during that period, existing customers (both government and commercial) grew their spend by ~46–50% on average, an unusually strong expansion. However, those figures reflected early ramp-ups on key contracts (for example, expansion of defense programs and initial Foundry rollouts in large companies). Such growth proved unsustainable as the customer base widened.
Government vs. Commercial Behavior
Palantir does not publicly report current NRR separately for government and commercial segments, but we can infer trends. The steep drop in total NRR from ~130% in 2021 to ~110% in 2022 suggests that government upsells tapered off significantly (since government was more than half of revenue). Those early big jumps in government spend (146% NRR) were likely one-time increases as agencies expanded initial deployments. After that, many government customers probably maintained steady spend (near 100% retention) or only modest growth, pulling that segment’s NRR down into the low 100s%. The commercial segment, meanwhile, has been growing faster and contributing more to upsell. In 2023–24 Palantir’s U.S. commercial revenue grew ~50% YoY, outpacing U.S. government’s ~38%. This implies strong expansion in many commercial accounts (along with new customer additions). We can reasonably deduce that commercial clients now have higher net retention than government clients, given their higher growth and Palantir’s focus on expanding usage of new offerings like its AI Platform (AIP) in the private sector. Management commentary has reinforced this: Palantir saw a “diversification away from core government business” with commercial traction, and acknowledges that future growth (and upsell) will be driven more by commercial clients.
Trend Analysis
Segment-level retention has thus converged to a more normalized level. In early years, both segments had outsized NRR due to low customer counts and rapid initial expansions. Now, with a broader base of ~900+ total customers, Palantir’s NRR stabilizing around 110–120% indicates that on average: government accounts are likely near 100–105% NRR (steady renewals with slight increases), while commercial accounts are higher (potentially 120%+ NRR in regions like U.S. commercial). This mix averages out to the reported total. Notably, Palantir’s international government business was once extremely high-retention (even >160% in 2021 on a small base), but international growth slowed in subsequent years, contributing to the overall NRR decline. On the other hand, the expansion of new commercial use-cases (e.g. AIP, Foundry for new industries) in 2023 has begun to lift NRR again. In Q2 2023 Palantir’s net retention was 114%; by Q4 2024 it reached 120%, a 12 percentage point YoY increase as existing customers adopted more of Palantir’s AI capabilities. This uptick supports the view that commercial upsell momentum is returning, while government remains a stable anchor.
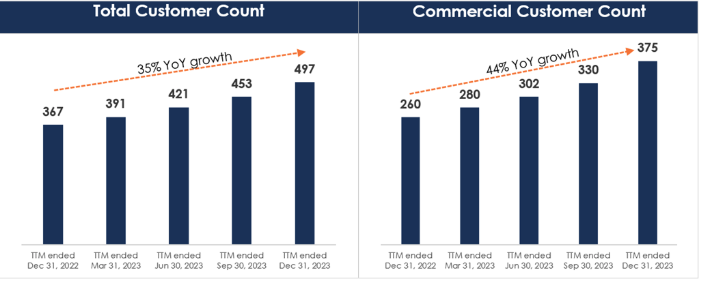
Going forward, Palantir’s shift toward a higher mix of commercial revenue should bolster NRR modestly. Commercial clients generally present greater upsell opportunities – they can expand from one department to company-wide, add new product modules, or increase data workloads over time. Palantir’s own strategy reflects this: its U.S. commercial customer count jumped 4.7× from 2019 to 2021 and continues to grow, and the company is actively leveraging its government-honed AI solutions to win more business with enterprises. As more of these commercial customers mature (and if Palantir’s land-and-expand sales execution improves), net retention could trend closer to peers. Management has explicitly pointed to AIP as a catalyst for expansion, expecting existing customers to increase spend as they integrate Palantir’s new AI offerings. In sum, Palantir’s government segment provides high retention but low expansion, while its commercial segment offers higher expansion potential – the balance of these two drives Palantir’s aggregate NRR. The current ~110% figure, while lower than Snowflake/Databricks, is still above the SaaS industry average and reflects Palantir’s unique dual-market strategy.
Switching Cost in terms of deal structure
Palantir addresses high-stakes challenges with software integral to mission-critical healthcare and military operations, creating significant switching costs. For instance, Tampa General Hospital’s collaboration with Palantir cut patient hospital stays by 30%, directly contributing to improved survival rates. Similarly, Palantir played a pivotal role in compiling intelligence that supported the capture of Osama Bin Laden. In situations where human lives depend on data-driven solutions, switching platforms can result in significant financial and intangible human losses.
Customer Growth
The company’s customer growth has rebounded sharply since mid-2023, driven by strong expansion in its U.S. commercial segment. This success is partly due to Palantir’s innovative boot camp strategy, which enhances engagement through numerous interactions with potential clients. Post-contract, a specialized onboarding process enables Palantir’s engineers to deeply understand customer data, customizing optimal solutions for intricate processes. This distinctive acquisition and retention strategy strengthens customer relationships and fosters sustained growth. Furthermore, Palantir has strategically diversified its revenue stream by expanding commercial clients, who typically offer more favorable contractual terms than government clients.
Risk and Uncertainty
I see Palantir having High Uncertainty, primarily due to the unpredictable scope of its total addressable market (TAM) and the unclear extent to which the company can penetrate that market.
In my view, the adaptability of Palantir’s ontology framework makes its software appealing across a wide range of industries, offering meaningful upside potential. However, the difficulty in accurately sizing the TAM—one of the core inputs in valuing the stock—means that any shift in market expectations can lead to sharp and painful corrections in the share price.
I’ve considered several demand scenarios, and the resulting valuation spread is exceptionally broad, underscoring just how much uncertainty investors must contend with. If the TAM ultimately proves smaller than I anticipate, the stock could underperform significantly.
While I see no direct peer matching the strength of Palantir’s ontology framework today, there remains a real risk that a major tech player, such as Google, could introduce a comparable AI platform. Should such competition emerge, it would likely pressure Palantir’s pricing and market share. That said, the firm’s 10–20-year lead in developing machine-learning-based solutions provides a meaningful defensive moat. Replicating or surpassing its offering would require any challenger to make massive, sustained R&D investments.
Data privacy is another key risk, given the sensitive nature of the information Palantir handles. A major cybersecurity incident could pose ESG concerns. Fortunately, the company’s Cipher platform employs advanced encryption protocols, and there have been no significant breaches to date.
Recent Development
2022: Challenging Start Amid Macro Headwinds
Q4 2021 Earnings (Feb 2022)
Palantir began 2022 on a shaky note. Its fourth-quarter 2021 results showed strong revenue growth but a larger net loss than expected, due in part to hefty stock-based compensation. Management’s lukewarm 2022 revenue guidance also underwhelmed investors. The stock fell about 15% after earnings, as markets grew wary of Palantir’s slowing government business and continued losses. Long-Term Implication: This early stumble set a cautious tone for the year, pressuring Palantir to improve profitability and execution in the face of tightening financial conditions.
Q1 2022 Earnings & War Outlook (May 2022)
Palantir’s first-quarter 2022 results confirmed decelerating growth. Revenue rose ~31% year-over-year, but earnings missed estimates (adjusted EPS of $0.02 vs. $0.05 expected) largely due to losses on Palantir’s SPAC investments. The company also issued a weaker Q2 revenue forecast (~25% YoY growth), citing uncertain timing of big government contracts. Shares plunged over 20% after the announcement. Management noted the war in Ukraine had not yet boosted results, though they anticipated future defense opportunities. Long-Term Implication: The disappointing quarter underscored Palantir’s reliance on governmental deal timing. It prompted Palantir to ramp up its salesforce (sacrificing margins near-term) in hopes of converting geopolitical developments (like increased defense spending amid the Ukraine war) into revenue later on.
Surging Inflation & Rate Hikes (Mid-2022 Macro)
Through 2022, macroeconomic forces weighed heavily on Palantir and other growth stocks. Inflation spiked to 40-year highs (~9% in the US), and the Federal Reserve embarked on aggressive interest rate increases (from near 0% to ~4% by year-end). This environment drove a broad tech sell-off, with unprofitable companies like Palantir seeing outsized declines. By late 2022, Palantir’s share price had sunk about 65% from its January levels, reflecting higher discount rates on future earnings. Long-Term Implication: The macro headwinds forced Palantir to emphasize efficiency and path-to-profitability. Investor sentiment shifted to favor companies with sustainable margins, pressuring Palantir’s management to aim for breakeven sooner than planned.
Q2 2022 Earnings & Guidance Cut (Aug 2022)
Palantir’s second quarter brought more turbulence. Revenue growth slowed to +26% YoY ($473 million), and the company unexpectedly posted a small adjusted loss as lingering SPAC investment losses hit the bottom line. In a key setback, Palantir cut its full-year 2022 revenue outlook to ~$1.90 billion (≈23% growth, down from 30%+ previously). Management blamed “frustrating” delays in government contract awards and foreign currency headwinds weighing on European sales. The stock tumbled about 14–15% on the news. Long-Term Implication: This was a pivotal moment – it became clear Palantir’s once-blistering growth was cooling. The company’s reliance on large, lumpy government deals introduced volatility, and management’s credibility took a hit with the lowered guidance. Palantir responded by doubling down on diversifying its client base (expanding commercial deals) and re-aligning expectations toward more modest, sustainable growth rates.
Strategic Partnerships and Contracts (Late 2022)
Despite a tough year, Palantir secured notable deals that laid groundwork for recovery. In September 2022, Palantir expanded its partnership with South Korea’s Hyundai Heavy Industries, including a $20 million, five-year contract to deploy Palantir’s Foundry platform across shipbuilding and industrial operations. And in the public sector, Palantir won a 5-year, $443 million contract with the U.S. Centers for Disease Control (CDC) to power a disease surveillance data platform. These wins did not immediately move the stock amid bearish market sentiment, but they reinforced Palantir’s long-term opportunities. Long-Term Implication: The Hyundai deal demonstrated Palantir’s push into international and commercial markets, reducing dependence on U.S. government spending alone. The CDC contract highlighted Palantir’s role in critical infrastructure (public health analytics), suggesting a widening moat in government work. Together, these “minor” victories in 2022 provided future revenue streams and reference cases that could spur additional clients.
Q3 2022 Earnings (Nov 2022)
Third-quarter results mirrored prior trends. Revenue growth was +22% (slipping further), and adjusted earnings were just $0.01 per share (a penny shy of forecasts). Notably, Palantir’s U.S. government revenue rose solidly (+26%), but its commercial revenue growth decelerated to 17%, hurt by soft European demand and a strong dollar. The company did reaffirm its lowered full-year guidance (~$1.9 billion revenue), suggesting no further deterioration. The stock fell about 11% on these mixed results. Long-Term Implication: Q3 likely marked the bottoming-out of Palantir’s slump. Investors had largely priced in the bad news by this point – the consistent (if slower) growth and stabilization of guidance helped set the stage for a potential turnaround. Palantir’s focus on controlling costs and weathering the macro storm hinted that better profitability could be within reach once revenue re-accelerated.
2023: Pivot to Profitability and AI-Fueled Rebound
Q4 2022 Earnings – First GAAP Profit (Feb 2023)
Palantir kicked off 2023 with a breakthrough. In its fourth-quarter 2022 report, Palantir announced its first-ever quarter of positive GAAP net income (about $0.01 GAAP EPS, or $0.04 on an adjusted basis). Revenues grew 18% YoY to $509 million, slightly beating expectations. More importantly, management forecasted 2023 would be Palantir’s first profitable year on a GAAP basis and highlighted newfound expense discipline (slower hiring, cutting cloud costs). The company also touted rising interest in artificial intelligence solutions, noting the buzz from OpenAI’s ChatGPT as a tailwind for Palantir’s own AI capabilities. The stock surged 15–20% in after-hours trading on the upbeat news. Long-Term Implication: This quarter was a turning point. Achieving profitability addressed a major investor concern and validated Palantir’s efforts to rein in costs. It gave the company financial flexibility and credibility to pursue growth initiatives. Additionally, management’s focus on AI positioned Palantir to ride a coming wave of demand for enterprise AI integration – hinting that 2023 could couple improving finances with innovation.
Macro Trend – AI Boom and Tech Rally (Early/Mid-2023)
As 2023 progressed, a broader boom in generative AI dramatically shifted market sentiment in Palantir’s favor. Interest rate hikes began to slow and inflation eased, but the standout factor was investor enthusiasm for any company tied to AI. By spring 2023, major advancements like GPT-4 had companies scrambling for AI solutions. Palantir, with its long-standing AI and data analytics pedigree, was seen as a key beneficiary of increased government and corporate AI spending. This macro narrative, combined with Palantir’s newly established profitability, led to a sharp recovery in the stock. From January through July 2023, Palantir’s shares roughly doubled, as investors anticipated that Palantir’s platforms (Foundry, Gotham) and new AI offerings would see surging demand. Long-Term Implication: The AI frenzy provided Palantir an opportunity to redefine its value proposition. No longer viewed solely as a slow-growth defense contractor, Palantir began to be seen as an AI powerhouse. This broadened investor base and set the stage for accelerating sales, especially in the commercial segment, as clients looked to Palantir for cutting-edge AI-driven data analysis.
Q1 2023 Earnings & AIP Launch (May 2023)
Palantir’s first quarter 2023 results reinforced the positive momentum. Revenue grew 18% YoY to $525 million (beating estimates), and adjusted EPS of $0.05 topped forecasts, marking a second consecutive GAAP-profitable quarter. On the earnings call, Palantir stunned observers by announcing it expects to remain profitable every quarter of 2023. The company also unveiled its new Artificial Intelligence Platform (AIP) – a suite allowing customers to harness large language models (the same type of AI behind ChatGPT) on their private data. Early AIP pilots were underway with major clients in insurance, supply chain, and defense. Investors cheered these developments, and the stock jumped about 20% in post-market trading. Long-Term Implication: This quarter signaled that Palantir’s turnaround was in full swing. Consistent profitability allayed financial concerns, while the AIP launch proved Palantir could innovate rapidly in the hottest area of tech. The immediate stock surge reflected optimism that AIP could unlock new commercial use cases (e.g. helping militaries with AI targeting or enterprises with AI-powered decision-making). In the long run, AIP opened a potentially vast new growth avenue and helped Palantir attract strategic partnerships in the AI space.
Steady Growth and New Deals (Mid/Late 2023)
Through mid-2023, Palantir capitalized on its momentum with steady growth and significant contract wins. In the second quarter (Q2 2023), revenue rose a slower 13% (to $533 million), but Palantir beat earnings expectations and raised its full-year outlook slightly. Government revenue re-accelerated over 20% thanks to larger Pentagon projects, and U.S. commercial sales continued to expand double-digits. The stock remained buoyant. Over the summer, Palantir won a prototype contract from the U.S. Army’s TITAN program (~$180 million) to develop an AI-driven battlefield intelligence system, and secured other defense deals as the Pentagon invested more in AI. These deals, while not headline-grabbing to the public, expanded Palantir’s backlog. By the third quarter (Q3 2023), Palantir posted ~17% revenue growth and its third straight quarter of profitability, in line with expectations. Long-Term Implication: The mid-2023 period showed Palantir turning its hype into tangible business. The company was no longer just promising future potential – it was delivering consistent earnings and booking sizeable contracts in both defense and commercial sectors. This execution created a foundation for accelerating growth if macro conditions or big projects (like global defense initiatives) broke in Palantir’s favor.
Major NHS Contract in UK (Nov 2023)
A significant milestone came in late 2023 when Palantir was awarded the contract for Britain’s National Health Service Federated Data Platform. This deal, valued up to £330 million (~$412 million) over seven years, named Palantir as the lead provider of the NHS’s new patient-data management system. The contract had been controversial due to privacy concerns, but Palantir’s win cemented its role in Europe’s healthcare analytics. The immediate stock reaction was muted (the news came amid general market volatility), but analysts viewed it positively as it expands Palantir’s footprint in a huge sector. Long-Term Implication: Winning the NHS platform is strategically important. It showcases Palantir’s ability to handle sensitive, large-scale civil data projects, not just military intel. This could lead to more healthcare (or other civilian agency) opportunities globally. Financially, the contract provides a stable long-term revenue stream. It also demonstrates Palantir’s resilience in highly competitive bids, enhancing its reputation outside the U.S. market.
2024: Acceleration, AI Dominance, and New Highs
Full-Year Profit & Cautious Outlook (Feb 2024)
Palantir reported its 2023 full-year results in early 2024, confirming that it achieved GAAP profitability for the year. This capped off a remarkable turnaround from the losses of 2022. However, the initial 2024 revenue guidance offered by management was somewhat conservative (high-teens percentage growth forecast, roughly in line with 2023’s pace). Investors, who had bid the stock up on AI excitement, were looking for an even more aggressive outlook. As a result, after the fourth-quarter 2023 earnings release, Palantir’s stock saw only a modest uptick – enthusiasm was tempered by the prudent guidance. Long-Term Implication: By now, profitability was expected, so the focus shifted to growth re-acceleration. Palantir’s careful guidance suggested it didn’t want to over-promise, perhaps due to uncertainties in Europe and timing of big contracts. This set up 2024 as a “show me” year: the company needed to prove that the AI-related demand would translate into substantially higher revenue growth.
Q1 2024 Earnings & Stock Pullback (May 2024)
In the first quarter of 2024, Palantir delivered solid results – continuing GAAP profits and ~18% revenue growth – but the market’s attention was on future guidance. The company did raise its full-year 2024 revenue forecast slightly (citing strong AI services demand), yet this upgrade still fell short of the market’s lofty expectations after a massive run-up in the share price. Palantir also noted some unavoidable headwinds in Europe and a longer sales cycle for certain deals. This conservative outlook triggered a sharp selloff; shares dropped over 15% in their worst single-day decline since 2022. Despite the knee-jerk reaction, many analysts remained positive, calling the underlying results “solid” with healthy U.S. commercial growth and widening margins. Long-Term Implication: The May 2024 pullback was a reality check on valuation. It reminded investors that, even in an AI boom, Palantir’s growth would not be limitless quarter to quarter. Importantly, the company still raised guidance – signaling confidence in strong demand – just not as dramatically as some hoped. The stock drop also reset expectations to more reasonable levels, arguably paving the way for further gains as the year progressed and Palantir’s momentum became undeniable.
Defense Contracts Surge – Project Maven (Mid-2024)
Around mid-2024, Palantir’s position in the defense AI arena was emphatically reinforced. In May 2024, the U.S. Army awarded Palantir a $480 million contract to lead Project Maven’s next phase – an artificial intelligence program to analyze military drone and surveillance footage. This was one of Palantir’s largest contracts to date, extending through 2029. It signaled that the Pentagon was deeply committed to Palantir’s technology for mission-critical AI applications. The immediate market reaction to the contract win was positive but measured (large government deals are often long-term in revenue realization). However, it boosted investor confidence that Palantir’s pipeline was blossoming. Coupled with other wins – like an extension of its Army Vantage program worth up to ~$600 million (announced in late 2024) – Palantir’s backlog of government business swelled. Long-Term Implication: These defense mega-deals have profound implications. They lock in multi-year revenue streams and validate Palantir’s status as a go-to provider of AI solutions to the military. The scale of the contracts also suggests Palantir’s technology (including its new AI Platform) is viewed as indispensable for next-generation defense systems. Over time, such deals can drive accelerated growth and high-margin revenue, given Palantir’s software economics.
Q2 2024 – Growth Reignites (Aug 2024)
Palantir’s second-quarter 2024 earnings marked a turning point to outright re-acceleration. The company surprised investors with 36% YoY revenue growth for the quarter – a big jump from the ~18% rates earlier – driven by booming demand in the United States. U.S. revenue was up over 50% as commercial customers scaled AI deployments and government agencies ramped projects like Project Maven. Palantir also recorded its largest-ever quarterly profit and substantially raised its full-year outlook for both revenue and operating income. Notably, management projected ~31% revenue growth for 2025, well above prior consensus. These results crushed expectations and the stock soared roughly 12%–15% in after-hours trading, continuing a strong uptrend. Long-Term Implication: Q2 2024 demonstrated that Palantir could convert the hype around AI into actual top-line acceleration. The inflection in growth suggested that years of pilot programs and smaller deals were now translating into wide-scale adoption of Palantir’s platforms. The raised guidance for 2025 indicated management’s confidence that this was not a one-quarter blip but the start of a sustained high-growth era fueled by AI. For the business, this meant improved economies of scale and the potential to significantly expand margins and cash flow in coming years.
Partnerships and Politics (Late 2024)
By late 2024, Palantir not only enjoyed strong earnings but also favorable external tailwinds. In December 2024, Palantir formed a strategic alliance with Anduril Industries (a fast-growing defense tech firm) to jointly develop AI-driven military technology. This partnership between two leading defense innovators aimed to tackle challenges in integrating and scaling AI for the U.S. military, potentially unlocking new contract opportunities. Meanwhile, the U.S. political climate shifted with the late-2024 elections. Anticipation of a more defense-friendly administration and increased government spending on military and security projects contributed to bullish sentiment on Palantir. Investors bet that a higher defense budget and pro-tech policies would benefit Palantir’s government segment. By the end of 2024, Palantir’s stock had skyrocketed – rising approximately 340% over the year – and reached all-time highs. Long-Term Implication: These developments fortified Palantir’s long-term outlook. The Anduril partnership signaled that Palantir is intent on maintaining a leading edge in defense AI by teaming up with complementary innovators, which could accelerate product development and contract wins. Politically, a climate favoring big defense and infrastructure investments bodes well for Palantir’s pipeline (both defense and even areas like healthcare or energy where government plays a role). However, the soaring stock price also set the stage for greater volatility ahead, as expectations would need to be met or exceeded to sustain such valuations.
Early 2025: Peaks and Volatility
Q4 2024 Earnings – Record Results (Feb 2025)
Palantir’s fourth-quarter 2024 earnings release was nothing short of a blowout. The company reported record revenue and profit, capping off a year of accelerating growth. Revenue for Q4 jumped about 36% year-on-year (reaching the $700+ million range for the quarter), propelled by surging U.S. commercial sales and ramp-ups of major government programs. Profitability also expanded significantly – adjusted operating margins improved as the influx of revenue outpaced costs. Perhaps most striking was Palantir’s forward guidance: management forecasted 31% revenue growth for full-year 2025, well above analyst expectations. This strong outlook “eviscerated” consensus estimates and signaled confidence that the AI-driven growth spurt would continue. The market reaction was exuberant: Palantir’s stock spiked over 20% in one day, hitting new highs (shares traded into the low $100s, giving the company a market capitalization north of $200 billion). Long-Term Implication: This moment represented the pinnacle of investor optimism. Palantir had proven its ability to scale revenue rapidly while maintaining profitability – a combination that could yield tremendous cash generation if sustained. The company’s ambitious 2025 guidance implied that the previous year’s contract wins and product innovations (like AIP) would keep bearing fruit. For Palantir’s strategy, it indicated a successful transition from a niche software provider into a mainstream enterprise and government AI platform. The company’s challenge moving forward would be managing this growth responsibly and continuing to deliver breakthroughs to justify its premium valuation.
Market Jitters – Profit Taking and Budget Concerns (Mar 2025)
Shortly after reaching its peak, Palantir’s stock saw a bout of significant volatility. In late February 2025, news emerged that CEO Alex Karp planned to sell roughly $1 billion of his Palantir shares over time. While insiders often liquidate some holdings, the size of the planned sale surprised the market and prompted worries about valuation. Around the same time, commentary surfaced about potential cutbacks in government spending – with officials in Washington discussing tighter budgets and deficit reduction after years of heavy outlays. Given Palantir’s reliance on government contracts, this sparked concern that its jaw-dropping growth might moderate in the future. These factors combined to trigger a rapid pullback: within a couple of weeks, Palantir’s stock fell about 30% from its highs, erasing some of its early-2025 gains. Long-Term Implication: This volatility was a reminder that Palantir’s stock, after such a huge rally, was priced for perfection. Any hint of insider selling or macro constraints could instigate sharp corrections. From a business perspective, the talk of budget tightening suggested Palantir may face a more measured flow of government deals looking ahead, especially if political priorities shift. However, it’s worth noting that even after the pullback, Palantir’s shares remained dramatically higher than a year prior, reflecting underlying confidence in its business. The company’s task will be to navigate these fluctuations by continuing to diversify its customer base (more commercial clients can balance government cyclicality) and by excelling in execution to retain investor trust.
Looking Ahead (as of April 2, 2025)
Entering the second quarter of 2025, Palantir stands in a fundamentally stronger position than it was a few years prior. The period from 2022 through early 2025 has seen the company transform from an unprofitable, uncertainty-shadowed venture into a profitable, high-growth leader in AI and data analytics. Its stock price, though volatile, reflects a substantial market recognition of that progress. Macroeconomic conditions are a mixed bag: interest rates remain elevated compared to the early 2020s (keeping financing costs higher and growth stock valuations sensitive), but easing inflation and a resilient economy provide a stable backdrop for enterprise spending. Government policy is another evolving factor – while there is pressure to trim budgets, defense and AI remain priority areas in many countries, likely insulating Palantir’s core business to some degree. Long-Term Implication: Palantir’s strategic focus on artificial intelligence, coupled with disciplined financial management, has positioned it to capitalize on the biggest technology and security trends of the mid-2020s. The company’s challenge going forward will be to sustain innovation and top-line momentum (to meet high expectations) while adapting to any macro or policy changes. If it succeeds, Palantir could further entrench itself as a critical software contractor for governments and a go-to AI platform for corporations – reinforcing its competitive moat and supporting continued growth in revenue and shareholder value.
Financial Statement Analysis
| Metric | 2022 | 2023 | 2024 |
|---|---|---|---|
| Operating Income ($M) | –161 | 120 | 310 |
| Net Income ($M) | –374 | 210 | 462 |
| EBITDA ($M) | –139 | 153 | 342 |
| Free Cash Flow to Firm ($M) | –267 | 200 | 321 |
| Wtd. Avg. Diluted Shares (B) | 2.064 | 2.298 | 2.451 |
| EPS (GAAP) | –0.18 | 0.09 | 0.19 |
| Net Income Margin | –19.6% | 9.4% | 16.1% |
| P/E Ratio | N/A | N/A | 184.5 |
| ROA | Negative | ~3–5% | ~7–8% |
| ROE | Negative | ~6% | ~10% |
| ROIC | Negative | ~3% | ~6% |
Notes: “N/A” indicates not applicable (e.g. P/E in 2022–23 was not meaningful due to negative or minimal earnings).
Operating Income, Net Income, and EBITDA Analysis
Turnaround from Losses to Profits
Palantir’s operating and net profits swung from negative in 2022 to positive by 2024. In 2022, the company incurred a GAAP operating loss of $161 million (–8% operating margin) and a net loss of roughly $374 million (–19.6% net margin). By 2024, Palantir achieved GAAP operating income of $310 million (11% margin) and net income of $462 million (16% margin). This represents a dramatic improvement, with net income rising by over $800 million from 2022 to 2024. EBITDA followed a similar trajectory – improving from a negative $139 million in 2022 to a positive $342 million in 2024 (an increase driven by higher operating profit and only modest depreciation/amortization).
Drivers of Margin Expansion
The transition to profitability was driven by both revenue growth and cost optimization. Revenue grew about 50% from 2022 to 2024 (from ~$1.91 billion to $2.87 billion), providing scale. Meanwhile, operating expenses grew much more slowly, enabling margin expansion. For example, operating costs in 2024 were up only 19% year-over-year despite 29% higher revenue. This indicates improved operational efficiency and discipline in spending. Notably, Palantir’s stock-based compensation – while still high – was better absorbed by a larger revenue base. Stock-based comp expense did increase to $691.6 million in 2024 (up 45% YoY due to new equity grants and a one-time stock appreciation rights (SARs) vesting) but as a percentage of revenue it held roughly steady. In effect, the company managed to grow its top line faster than its core operating costs, yielding higher operating margins.
Cost Optimization and One-Time Items: Palantir made a strategic shift toward cost control and profitability in this period. Management curtailed the pace of hiring and became more selective in spending, as evidenced by SG&A and R&D growing slower than revenue. Additionally, certain extraordinary expenses that weighed on 2021–2022 results were reduced or eliminated. For instance, Palantir had made a series of speculative investments in SPACs (startups via special-purpose acquisition companies) that backfired – by 2022 it wound down this program, having lost over $300 million on these investments. Those losses (recorded in other expenses) contributed to the 2022 net loss. By discontinuing such non-core activities, Palantir avoided further write-downs in 2023–2024. The company’s first full year of GAAP profitability came in 2023, with net income of $210 million (9% net margin), and improved dramatically in 2024 as operational efficiencies took hold. Palantir’s CEO noted that 2024’s results “astound” and reflect the company’s central role in the emerging AI market – hinting that management’s focus shifted to delivering profitable growth from its AI platform. Overall, margin expansion was achieved through a combination of revenue scale, controlled expense growth, and elimination of prior one-time losses.
Free Cash Flow to the Firm (FCFF) Analysis
FCFF Improvement: Palantir’s free cash flow to the firm (FCFF) improved from –$267 million in 2022 to $321 million in 2024, a swing of nearly $600 million. In 2022, Palantir’s operating cash flow was weighed down by low operating earnings and working capital uses, resulting in negative free cash outflow. By 2024, the company generated substantial cash. Operating cash flow reached $1.15 billion in 2024 (40% of revenue), far exceeding the modest capital expenditures (Palantir’s business is software-focused, requiring relatively low CapEx). Even after any investments and lease payments, FCFF turned solidly positive.
Key Factors: Several factors drove this FCFF improvement:
- Rising Operating Income: The most fundamental driver was the jump in operating profit. Net income of $462 million in 2024, adjusted for non-cash expenses, translated to strong cash generation. Notably, Palantir’s heavy stock-based compensation, while an expense in GAAP net income, is added back in cash flow – for example, the $691.6 million of stock comp in 2024 was a non-cash cost that boosted operating cash flow when excluded. As Palantir became profitable, this stock comp (and other non-cash items like depreciation) made operating cash flow far higher than net income, aiding FCFF.
- Working Capital and Efficiency: Palantir saw favorable working capital dynamics in this period. The company’s customer base and deal sizes grew, often with upfront payments for multi-year contracts. In 2024, cash from operations was 2.5x net income, partly due to collections from customers (increasing deferred revenue and reducing DSO). Improved collections and relatively stable payables/expenses meant less cash tied up in working capital. By contrast, in 2022 Palantir had used cash for things like funding pilot projects and absorbing slower collections, which hurt free cash flow. The shift to more efficient working capital management by 2024 freed up cash.
- CapEx and Investments: Palantir’s capital expenditures remained low (the company primarily uses cloud infrastructure rather than owning data centers). With CapEx minor, operating cash flow improvements flowed directly into FCFF. Additionally, Palantir drastically cut back on its equity investments in other companies. In 2021–22, it spent hundreds of millions investing in client startups (the SPAC program), which was recorded as investing cash outflow. By ceasing this program in 2022, those cash outflows disappeared going forward. In sum, less cash was diverted to risky investments, boosting free cash available to the firm.
- No Debt Burden: Palantir carries no debt on its balance sheet, so its FCFF wasn’t reduced by interest payments. In fact, rising interest rates meant Palantir earned interest income on its large cash reserves, supplementing cash flow. The absence of debt also meant no principal repayments draining cash.
By 2024, Palantir’s FCFF of $321 million reflects a healthy cash-generating business, versus the cash burn in 2022. This improvement underscores the company’s better operating efficiency and more disciplined capital allocation. Management’s focus on profitable growth and winding down non-core uses of cash positioned Palantir to fund its own expansion and even return cash to shareholders (via buybacks) by 2024.
Weighted Average Diluted Shares Outstanding Analysis
Palantir’s diluted share count increased significantly from 2.064 billion in 2022 to 2.451 billion in 2024 (Document). This ~19% rise (about 387 million additional shares) was primarily due to stock-based compensation (SBC) awards to employees and, to a lesser extent, small strategic equity issuances – partially offset by the initiation of share buybacks in late 2023–2024.
To illustrate the key events affecting share count, the table below summarizes major share issuance or repurchase events in this period:
| Date (Year/Qtr) | Event (10-word summary) | Shares Changed | Share Price ($) |
|---|---|---|---|
| FY 2022 | Employee RSU vesting & option exercises (SBC dilution) | +~140 million | ~$10 (avg) |
| FY 2023 | Continued stock-based comp issuance; no buybacks yet | +~230 million | ~$15 (avg) |
| Aug 2023 | Board authorizes $1B share buyback program (no immediate effect) | 0 | ~$16 (annc.) |
| FY 2024 | First share repurchases: ~2.1M shares (~0.1% of float) bought back | –2.1 million | ~$30 (avg) |
Stock-Based Compensation Issuance: The dominant source of dilution was Palantir’s generous equity compensation. The company has historically granted large RSUs and stock options to attract and retain talent. In 2022, as early post-IPO grants vested, roughly 140 million new shares were issued to employees (either through RSU releases or option exercises). This trend continued in 2023 with an estimated ~230 million shares issued as SBC. Crucially, these shares were issued when Palantir’s stock price was relatively low (often in the high-single-digit to low-teens dollars), magnifying the dilution. For example, in 2022 Palantir traded between ~$6 and $18; issuing shares at those prices meant a higher share count impact per dollar of compensation. The cumulative effect is clear: stock-based comp pushed the diluted share count from about 2.06B to 2.30B by 2023. Palantir’s SBC expense was $692 million in 2024 alone, so dilution remained a concern (though management argues this aligns employee incentives with shareholders).
Equity Issuance/Other: Apart from employee compensation, Palantir did not undertake significant equity financings in 2022–2024 – it did not need to, given its ample cash. However, Palantir occasionally issued small amounts of stock in strategic deals. For instance, it sometimes paid vendors or partners in stock or invested in client companies in exchange for equity. These instances were minor (e.g. on the order of a few hundred thousand shares) and did not materially impact the overall share count. Essentially, there were no public secondary offerings or major acquisitions paid in stock during this period. The share count increase is almost entirely attributable to internal factors (SBC), not external fundraises.
Share Buybacks: In August 2023, Palantir’s board authorized a $1.0 billion share repurchase program – the first buyback plan in the company’s history. This marked a strategic shift, signaling management’s commitment to managing dilution and returning excess cash to shareholders. The announcement came amid a roaring stock rally in 2023 (Palantir shares had nearly tripled year-to-date by that point). Initially, the authorization had no immediate effect on share count (no shares were repurchased in Q3 2023). By 2024, Palantir cautiously began buybacks: it repurchased 2.123 million shares for $64.2 million during 2024. This amounted to only ~0.1% of outstanding shares, barely denting the dilution from SBC. (The average repurchase price was about $30/share, and notably some buybacks in late 2024 were executed at even higher prices over $50/share – reflecting the stock’s steep rise.) As of year-end 2024, $935.8 million remained available under the buyback authorization for future repurchases.
Net Impact: Overall, Palantir’s share count has increased substantially despite the new buyback program. Stock-based compensation was the overwhelming contributor to the rise from 2.064B to 2.451B shares. The nascent buybacks only offset a fraction of new issuance. Investors will be watching how aggressively Palantir uses the remaining buyback capacity in 2025 and beyond to counter dilution. Management has indicated an awareness of dilution concerns and a willingness to moderate SBC grants relative to growth, but the 2024 figures show dilution is still occurring (albeit at a slowing rate). Going forward, if Palantir’s cash flows remain strong, the company could repurchase more shares to stabilize or even reduce the count – but as of 2024, dilution outpaced buybacks.
Earnings Per Share (EPS) Impact Analysis
Earnings Growth vs. Share Growth: Palantir’s EPS improved dramatically from –$0.18 in 2022 to $0.19 in 2024, reflecting the swing from net losses to profits. This improvement was driven by the surge in net income discussed earlier, but it was partially offset by the expanding share count. Essentially, Palantir had to “swim upstream” against dilution to grow its per-share earnings.
- 2022: Palantir’s GAAP EPS was –$0.18, calculated on ~2.06 billion shares. The net loss was so large that even a smaller share count could not prevent a sizable negative EPS.
- 2023: By 2023, Palantir achieved positive net income of $210 million. However, the weighted diluted shares had grown to 2.30 billion. As a result, GAAP EPS for 2023 was only about +$0.09. If the share count had remained at 2022 levels, EPS would have been higher ($0.10+). The ~11% increase in shares outstanding diluted the impact of earnings – effectively “spreading” $210M of earnings over more shares. Despite that, EPS flipped to positive due to the overall profit achieved.
- 2024: In 2024, Palantir’s net income more than doubled to $462 million. The share count also rose further (about 6.6% higher than 2023). Net income growth far outpaced share growth, so GAAP EPS jumped to $0.19. Notably, if Palantir had held its share count constant at the 2022 level, 2024 EPS might have been around $0.22–$0.23; the dilution shaved a few cents off EPS. Nonetheless, the strong earnings increase (over 120% year-on-year) outweighed the dilution effect.
Net Impact on EPS: The interplay between earnings and share count can be quantified by looking at net income margin and share growth. Palantir’s net margin improved from –19.6% to +16.1% (a 35-percentage-point swing), whereas its share count rose 19% over the period. Thus, EPS went from negative to positive. Between 2022 and 2024, EPS increased by ~$0.37. If shares had stayed flat, EPS would have increased even more ($0.40+), but roughly $0.03 of EPS was “lost” to dilution. In percentage terms, however, the EPS improvement is huge (from –$0.18 to +$0.19, a ~$0.37 change on a base of negative earnings). This underscores that earnings growth was the dominant factor, with dilution a secondary drag.
It’s also worth noting Palantir’s use of adjusted EPS in communications. For 2024, adjusted EPS (which excludes SBC) was $0.41. But GAAP EPS of $0.19, while much lower, is the figure that drives the P/E ratio and is affected by share count. Looking ahead, if Palantir can continue growing net income while slowing the issuance of new shares (or actively buying back shares), EPS could grow at an even faster rate than net income. The new buyback program signals an intent to manage the share count. In summary, Palantir’s EPS has turned positive and is rising due to profit growth, but continued dilution tempered the per-share gains somewhat up to 2024. The company’s challenge will be to keep driving strong earnings and mitigate dilution so that EPS growth remains robust.
Net Income Margin Analysis
Improvement in Net Income Margin: Palantir’s net income margin improved from –19.6% in 2022 to +16.1% in 2024. This is a remarkable turnaround of over 35 percentage points. Essentially, in 2022 Palantir lost about 20 cents for every dollar of revenue, whereas in 2024 it earned about 16 cents on each dollar of revenue as profit. By 2024, Palantir’s net margin was in line with other mature software companies, after being deeply negative two years prior.
Key drivers of this margin improvement include:
- Cost Structure and Operational Leverage: Palantir was able to grow revenue without commensurate growth in expenses, as discussed. Fixed costs (like core R&D and administrative expenses) were leveraged over higher sales. Gross margin remained very high (~80%), so incremental revenue largely fell to the bottom line once overhead growth was contained. In 2022, the company’s operating expense consumed over 100% of revenue (hence the negative margin). By 2024, operating expense was about 69% of revenue (operating margin 11%), and after adding net other income, net margin reached 16%. This indicates Palantir’s business model scaled: its software deployments became more efficient and required proportionally less sales expense to generate revenue than before. Management also exercised more discipline – for example, sales & marketing expense grew only 9% in the first nine months of 2024 vs. the same period in 2023, even as revenue grew ~20%+ in that span. Such cost containment directly boosted net margins.
- Revenue Mix and Growth: Palantir’s revenue mix shifted slightly in favor of the commercial segment (which can carry higher margins once established). The company’s U.S. commercial revenue grew 54% in 2024, bringing in high-margin software deals. Meanwhile, government revenue (which is typically high-margin as well) also grew ~30%. There isn’t evidence that margin improvement came from a dramatically different mix of business, but rather from more revenue across the board without proportional cost increases. The net margin expansion was “driven by higher revenue,” as one analysis noted for 2024 vs 2023. Simply put, growth helped dilute the impact of fixed costs and stock comp, lifting net margin.
- Stock-Based Compensation Moderation: Although SBC remained high, Palantir’s net margin benefited from the relative decrease of SBC expense as a percentage of revenue from 2021 to 2023. In 2021 (just after the IPO), SBC was extraordinarily high, suppressing margins. By 2022, SBC expense was still large (~30% of revenue), but in 2023 it dropped to ~23% of revenue (rough estimate) as prior large grants had been expensed. This trend slightly improved operating margins. However, in 2024 SBC ticked up again to 24%+ of revenue (due to the one-time SARs), so SBC did not contribute to margin expansion in 2024 – but other efficiencies did. We can infer that excluding stock comp, Palantir’s underlying net margin is much higher (indeed, adjusted net margin was about 20%+ in 2024). The gradual normalization of SBC costs post-IPO was one factor in the GAAP margin rising from deep negatives toward positive territory.
- Reduced One-Time Charges: As noted earlier, Palantir eliminated unusual losses that hit 2021–2022 profits. The wind-down of the SPAC investment program removed a drag on net income. For example, in 2022 Palantir likely absorbed >$200–300 million of losses on investments – roughly 10–15% of revenue – which directly lowered net margin. By 2023 and 2024, those losses were gone. Additionally, interest income swung to a positive contributor (by 2024, interest income on $5+ billion in cash was significant). In Q4 2022, Palantir actually recorded its first positive GAAP net income partly thanks to $13 million in interest income that quarter. In 2023–24, rising interest yields added to net income (a small boost to net margin), whereas interest was negligible in 2022.
- Tax Effects: Palantir had accumulated net operating losses and was not a cash taxpayer in this period. Thus, net income was not reduced by taxes – effectively, the company had a 0% effective tax rate while losing money and even in early profitability. This helped improve net margins once pretax income turned positive, since there was no tax drag. (In the long run, taxes will normalize, but in 2022–24 this was a tailwind for net margin improvement.)
Competition and Pricing: One might ask if competition or pricing pressure affected margins. Palantir operates in a competitive data-platform market, but there’s no indication that it had to cut prices or accept lower-margin business to grow during 2022–24. Its gross margins around 80% suggest pricing remained strong. In fact, Palantir often highlights the unique value of its platform – it has been able to charge premium prices for mission-critical solutions (e.g., defense contracts, enterprise AI integrations). Therefore, competition did not visibly erode margins; if anything, Palantir’s strong product-market fit (especially with its new AI offerings) may have protected its margins by sustaining high revenue per customer.
In summary, Palantir’s net margin turned positive and climbed to 16% due to scaling revenues, a stable high gross margin, disciplined operating expense growth, and the absence of prior-year special charges. This margin expansion reflects a maturing business that is moving past its cash-burning startup phase into a profitable software company. Going forward, management expects expenses to rise to support growth (they cautioned that operating costs will increase as they invest in expansion) but as long as revenue growth stays robust, Palantir should be able to maintain healthy net margins. The company’s guidance and commentary suggest confidence in sustaining double-digit net margins while pursuing aggressive growth (for 2025 they even guided ~31% revenue growth, indicating optimism that margins can co-exist with expansion). Investors will watch whether one-time boosts (like zero taxes or interest income) normalize, but the underlying trend of improved profitability appears solid.
P/E Ratio Analysis
Palantir’s price-to-earnings (P/E) ratio reached an extremely high level of 184.5 in 2024. This figure indicates that at the 2024 year-end stock price, investors were willing to pay about $184 for each $1 of Palantir’s GAAP earnings – a rich valuation. Several factors help explain why Palantir’s P/E is so elevated:
- Investor Sentiment & Growth Expectations: A P/E of 184 suggests that investors are pricing in rapid future earnings growth. Palantir’s 2024 earnings were its first substantial profit, essentially a baseline for what bullish investors believe is just the beginning of a much larger earnings trajectory. The company is often viewed as a key player in artificial intelligence and data analytics, which has led to heightened enthusiasm. In 2023–24, Palantir’s stock was swept up in the “AI boom” in the market. In fact, Palantir’s stock price surged dramatically in 2024 – rising roughly 3-4x over the year. (One report noted the stock went from about $17 to $74 in 2024 amid AI optimism.) This huge increase in share price, far outpacing the rise in earnings, naturally blew up the P/E ratio. Investors were essentially looking past current earnings and betting on Palantir’s future, driven by excitement over its AI platform, new partnerships (e.g. with BP and defense contractors), and its inclusion in major indices (Nasdaq-100) which brought in more buyers. In short, sentiment was extremely bullish – Palantir was seen not just as a steady software firm, but as a potential big winner of the AI era. Such sentiment can sustain high P/E multiples, as the market “prices in” years of growth ahead.
- Small Earnings Base (Early Profitability): Because Palantir’s GAAP earnings were only $0.19 per share in 2024, any decent stock price will produce a high P/E. For example, at a $35 share price, the P/E = 35/0.19 ≈ 184. If the company had earned $1 per share, that same $35 price would be a modest 35x P/E. Palantir’s current earnings are small relative to its potential. This is typical for a company crossing into profitability – P/E appears very high initially. As earnings ramp up (the “E” in P/E grows), the multiple can drop quickly if the share price doesn’t rise in tandem. So part of this high P/E is a mathematical artifact of coming off near-zero earnings. It’s worth noting that on an adjusted basis Palantir earned $0.41 per share in 2024 (excluding stock comp). If some investors look at non-GAAP earnings, the effective P/E might seem lower (e.g. $35 price / $0.41 ≈ 85). However, the quoted 184.5 is based on GAAP EPS, which includes all costs.
- Market Position and “Quality” Premium: Palantir is often compared to high-growth software peers and even to big tech companies leveraging AI. Many of those companies also trade at high multiples, though usually not as high as 184. Investors may be assigning Palantir a “quality premium” for its sticky customer base (especially government clients with long contracts) and its improving profit profile. The company also has a fortress balance sheet (over $5B in cash, no debt), which lowers risk and could justify a higher valuation. Additionally, Palantir’s leadership (CEO Alex Karp and co-founder Peter Thiel) and its unique role in both commercial and government spheres give it a somewhat unique story that some investors are willing to pay up for. In 2024, as Palantir consistently beat earnings estimates and strengthened its outlook, analysts began raising price targets and some even spoke of Palantir as an “AI champion,” which contributed to multiple expansion.
- Sector Trends: The broader sector trend in 2023–24 saw AI-related stocks command lofty valuations. For instance, other AI software firms and even chip companies (like Nvidia) saw P/E ratios reach multi-year highs. Palantir, being vocal about its AI platform (AIP), tapped into this trend. The market in 2024 was willing to overlook traditional valuation metrics in favor of growth narratives. However, this also means Palantir’s P/E could compress if the broader sentiment shifts or if the company doesn’t deliver the growth implied.
Given this high P/E, one must consider the forward-looking aspects:
- Forward P/E Trajectory: If Palantir’s earnings continue to grow rapidly, its P/E should normalize to lower levels in coming years (assuming the stock price doesn’t rise as steeply). For example, Palantir’s own guidance and analyst estimates foresee strong growth in 2025. Suppose Palantir earns ~$0.40 GAAP EPS in 2025 (which would be ~110% growth). If the stock stayed around the mid-$30s, the forward P/E would drop to ~90. And by 2026, if EPS doubles again, the P/E would drop further. This is a classic case of a “PEG” (price/earnings to growth) story – high P/E now can be justified if growth is extremely high. However, if Palantir’s growth disappoints or if the stock has run too far ahead, the P/E could compress via a price drop. After the 2024 surge, Palantir’s stock did experience volatility; such a high P/E left little margin for error. Indeed, by early 2025 there was some pullback from the peak as the market digested just how fast Palantir can realistically grow.
- Comparables: It’s instructive to compare Palantir’s P/E to peers. Many software companies in 2024 still had no GAAP profits (P/E not meaningful) or had P/Es in the 30–100 range if profitable. Palantir at 184 stood out as an outlier, underscoring that it had just entered the profitable club. Over time, we’d expect Palantir’s P/E to converge downward. The company’s own performance will determine this trajectory: if it “grows into” its valuation by drastically increasing earnings, the P/E will fall to more normal levels. If earnings stagnate, the stock would likely fall to bring P/E down the hard way.
- Investor Perspective: The lofty P/E in 2024 suggests investors were focusing on long-term potential (10-year view) rather than current fundamentals. Bulls might argue Palantir could achieve $1+ EPS within a few years, making the forward P/E much more reasonable (for instance, some optimistic projections have Palantir’s revenue reaching $5+ billion by 2027 with significantly higher margins. Bears, on the other hand, pointed out that a 184 P/E is “priced for perfection.” Any slowdown in growth or hiccup in execution (or compression in market multiples due to interest rates) could cause a sharp correction. Indeed, Palantir’s stock has historically been volatile – after its initial post-IPO pop, it had a long drawdown through 2021–2022 when hype subsided. The 2024 AI-fueled rally reset the bar high.
Future Outlook: Palantir’s P/E will likely moderate as its earnings increase. Given that the company is now solidly GAAP profitable and expecting ~30% sales growth in 2025, net income could rise substantially (Palantir’s net income more than doubled in 2024, and a similar trajectory could continue in the near-term). If net income, say, doubles again in 2025 to ~$0.38 EPS, and if the stock price also increases but at a slower pace, the P/E could come down to something like 100–150 by end of 2025. In the longer run, as growth eventually tapers to more sustainable levels, we’d expect Palantir’s P/E to compress to far lower levels (e.g. 30–50 range). Achieving that could be a combination of earnings catching up and possibly some stock price cooling.
In summary, the P/E of 184.5 in 2024 reflects a market extremely optimistic about Palantir’s future. It was driven by a low earnings base, fervent AI-driven sentiment, and the assumption of high growth ahead. While such a valuation is risky if growth falters, Palantir’s strong balance sheet and improving profitability give some confidence. Going forward, all eyes are on Palantir’s execution – the P/E will likely compress, either via continued earnings growth (the preferred route) or, if necessary, via a correction in stock price if expectations get ahead of reality. As of early 2025, Palantir’s stock has indeed pulled back slightly from peak highs, but remains richly valued, indicating investors are still largely in “growth mode” for this name.
ROA, ROE, and ROIC Analysis
Trends from 2022 to 2024: Palantir’s return on assets (ROA), return on equity (ROE), and return on invested capital (ROIC) all improved markedly as the company transitioned to profitability:
- ROA: ROA measures net income relative to total assets. In 2022, Palantir’s ROA was negative because of the net loss – the company generated no return on its asset base. By 2023, ROA turned slightly positive (on the order of a few percent). And in 2024, ROA reached the high single digits (roughly 7–8%). This makes sense: Palantir had $6.34 billion in assets at the end of 2024 (much of it cash and short-term investments), and $462 million in net income, yielding about 7–8% ROA. Macrotrends data indicates a Q4 2024 ROA of 8.38%. So from ~0% in 2023 to ~8% in 2024, ROA saw a significant uptick. This reflects that the company is now using its assets (including its large cash pile and accounts receivable from customers) to generate profit, whereas before those assets were not yet yielding returns.
- ROE: ROE measures net income relative to shareholders’ equity. Palantir’s equity grew from about $2.9 billion in 2022 to $4.9 billion in 2024 (retained earnings turned positive, and additional paid-in capital grew via SBC). In 2022, ROE was negative (net loss vs. positive equity). In 2023, with $210M net income and ~$3.5B equity, ROE was around 6%. By 2024, $462M net income on ~$4.8B equity produced an ROE around 9–10%. This aligns with reported figures – for Q4 2024, ROE was about 10.5%. The improvement in ROE showcases Palantir’s increasing profitability on the shareholders’ capital employed. However, Palantir’s ROE is somewhat muted relative to its ROA because the company’s equity base is large (bolstered by cash from the IPO and SBC). Notably, Palantir has no debt, so equity equals the majority of its capital structure; ROE and ROIC are thus more comparable than in a leveraged company. The rise in ROE from ~0% to ~10% indicates that shareholders’ equity is finally being put to work to generate returns.
- ROIC: ROIC typically measures the return on operating capital (equity plus debt, minus excess cash), using operating profits. Given Palantir’s zero debt and cash-heavy balance sheet, ROIC can be diluted by the large cash holdings that are not needed for operations. According to Finbox, Palantir’s ROIC improved from –5.1% in 2022 to 3.1% in 2023 and 5.9% in 2024. This definition likely uses NOPAT (net operating profit after tax) over total capital. A 5.9% ROIC in 2024 suggests that if we take Palantir’s operating income $310M , adjust for taxes (still minimal), and divide by the total capital (~$5.3B, which is equity plus negligible debt), we get around 6%. This is consistent with Palantir’s ROIC “slightly deteriorating from 2023 to 2024” per one analysis – perhaps because invested capital grew faster than NOPAT in that year (Palantir’s asset base swelled with cash infusions from its strong cash flow). Importantly, if we exclude excess cash, Palantir’s ROIC would be much higher. Using only invested capital in operations (say, ~$1.1B of non-cash assets in 2024), the ROIC on that would be very high (20%+), reflecting the efficiency of its core business. But with cash included, ROIC is around mid-single digits at 2024. The trend is what matters: Palantir’s ROIC turned positive in 2023 and increased in 2024, indicating the business is now generating true returns on the capital employed, rather than consuming capital.
Drivers of Returns: The improvement in these return ratios is directly tied to increased profitability. In 2022, Palantir’s negative ROA/ROE was simply because of losses. By 2024, profits are positive, so returns are positive. A few specific drivers:
- Profitability vs. Asset Growth: Palantir’s total assets grew significantly (from $4.52B in 2023 to $6.34B in 2024), largely due to accumulating cash from operations. This asset growth can dilute ROA if profits don’t grow as fast. Indeed, one could argue Palantir’s ROA (~8%) in 2024 is relatively low because a huge chunk of assets is cash earning modest interest. The core business’s return on operating assets is higher. The company’s asset turnover is still low – revenue of $2.87B on $6.34B assets (~0.45x turnover). If Palantir deploys its cash into productive uses (like investments or buybacks) or if revenue continues to grow faster than assets, ROA will improve further. The fact that ROA rose despite asset growth means net income grew impressively.
- Capital Structure: With no debt, Palantir’s ROE is not boosted by leverage; it’s essentially an unlevered ROE. As such, the improving ROE purely reflects better net margins, as equity has increased only due to retained profits and SBC. (Equity grew by ~$1.4B from 2023 to 2024, while net income was $462M, the remainder mainly from new stock issuance via SBC.) Interestingly, if Palantir had significant debt, ROE might be higher (since equity would be lower), but the company deliberately maintains a debt-free stance. This conservative capital structure means a lower risk profile but also means ROE isn’t artificially amplified. ROIC is a better gauge of operational return in Palantir’s case: 5.9% in 2024 is still below its cost of capital (Palantir’s weighted average cost of capital is estimated ~15%. However, that WACC is high partly due to the stock’s high beta and no debt. As the company matures, its WACC may fall and ROIC should rise with margin expansion.
- Efficiency and Strategy: The improving return metrics indicate Palantir is becoming more efficient in converting its resources into profit. The company’s strategy of focusing on large, high-value contracts (both in government and Fortune 500) means it aims for “quality of revenue” which can enhance returns. For example, Palantir’s average revenue per top 20 customer was $54.6M in 2023, up from 2022 – extracting more revenue per customer can increase ROIC if costs don’t rise proportionally. Palantir’s investments in product (like the Apollo platform, AI integrations) are aimed at making deployments easier and more repeatable, which could improve margins and asset turnover (thus raising ROA/ROIC) over time.
Future Insights: Looking ahead, we can expect further improvement in ROA, ROE, and ROIC as profitability grows:
- ROA could rise if Palantir either returns cash to shareholders (reducing assets) or uses cash for acquisitions that generate additional income. With $5.2B in cash equivalents, there is potential to deploy this for higher returns. Palantir has hinted at possible strategic acquisitions or continued buybacks – either would potentially improve ROA (by either increasing income or reducing asset base). Absent that, if cash stays idle, ROA will gradually improve only as net income grows faster than assets.
- ROE should climb if net income grows. One nuance: Palantir’s equity will keep increasing from retained earnings (it added ~$462M to equity from 2024 earnings minus any buybacks) and from ongoing SBC (which increases contributed capital). So the equity base isn’t stagnant. To improve ROE, net income needs to grow at a faster rate than equity. In 2024, ROE ~10%; if net income doubles and equity grows 20%, ROE could jump to ~18%. Management’s decision to start buybacks, if executed, could actually reduce equity (by returning capital) and help ROE by concentrating the capital on productive uses. With $935M authorized for buybacks, if used, that would lower equity and share count, potentially boosting ROE and EPS.
- ROIC is a critical metric to watch for long-term value creation. Currently, Palantir’s ROIC (5.9% in 2024) is below its implied cost of capital. However, this is largely because of the cash dragging it down. Palantir’s core operations, once adjusted, are likely yielding double-digit returns. As the company continues to post higher operating profits, ROIC will rise. A rough estimate: if Palantir hits an operating margin of ~20% on $3.8B revenue in a couple years (which would be $760M operating profit), and if it doesn’t accumulate much more cash (i.e., invested capital maybe ~$6B), ROIC would be ~12.5%. That would be a solid improvement. The company’s challenge is to efficiently invest its cash – whether in R&D, acquisitions, or buybacks – to maximize ROIC. It already has no debt, so leverage isn’t a lever to pull; it’s all about operational return.
In conclusion, Palantir’s return metrics went from negative to positive from 2022 to 2024, reflecting its move into profitability. ROA rose to high single digits, ROE to around 10%, and ROIC to mid-single digits (higher if adjusted for cash). These trends should continue upward as the company grows earnings. Importantly, Palantir’s huge cash reserve both provides opportunity (for investment or return to shareholders) and currently tempers some ratios. The company is now at a strategic inflection where it must decide how to deploy resources for growth versus return. If Palantir executes well – growing profitably and using its capital wisely – we can expect ROA, ROE, and ROIC to improve further, moving closer to, or even exceeding, industry averages. Management’s recent actions (initiating buybacks, focusing on high-margin AI products) indicate an awareness of capital efficiency. As one measure, Palantir’s ROIC TTM was recently estimated around 31% when calculated on a trailing basis excluding excess cash, showing the underlying business is quite strong. Sustaining such performance will determine how high these return ratios go.
Overall, Palantir’s 2022–2025 financial story is one of steady financial improvement – from operating losses and negative margins to solid profitability and improving returns on capital. The company achieved this through strategic shifts to efficiency, a focus on lucrative opportunities (AI, government deals), and leveraging its existing strengths while addressing past weaknesses (like curbing unprofitable investments and managing dilution). All these factors are reflected across the metrics analyzed above. Palantir now enters 2025 with momentum: positive earnings, abundant cash, a clear demand for its products, and a plan to balance growth with shareholder returns – a combination that, if successful, should further strengthen its financial metrics in the years ahead.
Financial Health
I believe Palantir is in a strong and steadily improving financial position. As of December, the company held close to $2 billion in cash and $3.1 billion in marketable securities—primarily U.S. Treasury holdings—with no outstanding debt. Its liquidity grew by $1.5 billion in 2024, reflecting solid financial management.
The company has now achieved two consecutive years of GAAP profitability, with 2024 earnings more than doubling those of 2023. I anticipate continued momentum in both revenue growth and bottom-line performance.
While Palantir has previously drawn criticism for excessive stock-based compensation, which has impacted reported earnings, recent trends are more encouraging. A notable one-time expense of $120 million occurred in Q4 2024 when the share price exceeded $50, triggering a compensation milestone. However, I see this as an exception rather than an ongoing pattern. Between 2021 and 2023, stock-based compensation averaged 34% of revenue, but this ratio has been declining as the business matures. In 2023, the company also introduced a $1 billion share buyback program to help counteract shareholder dilution.
Looking ahead, I don’t expect major shifts in Palantir’s capital structure and remain confident in its ability to further enhance profitability over time.
Valuation
Determining Palantir’s (PLTR) long-term value requires careful consideration of several variables, with the Total Addressable Market (TAM) being one of the most critical yet challenging to project. The complexity arises not only from the firm’s unique position in the data analytics and software solutions space—enabling public institutions, large enterprises, and specialized clients—but also from the evolving demand patterns tied to geopolitical events and economic cycles. As a result, establishing a reliable growth trajectory for its cash flow becomes increasingly difficult, particularly in the absence of dividend payments and an elevated price-to-earnings (P/E) ratio that renders conventional valuation multiples less meaningful.
Instead, a discounted cash flow (DCF) approach offers a more nuanced perspective by focusing on cash generation capabilities and future potential. By excluding larger, often one-off deal transactions, this methodology can capture a more sustainable growth mean rate while reducing the distortion caused by unusually large government or corporate contracts. Nonetheless, the ongoing macroeconomic instability introduces further uncertainty. Fluctuating interest rates, geopolitical tensions, and evolving regulations can quickly alter public sector demand and impact funding priorities. Additionally, the risk of shifts in government policy or data privacy regulations could significantly affect Palantir’s ability to secure new contracts and maintain existing relationships.
Taking these factors into account, and integrating both the potential upside of continued client expansion and the downside risks associated with regulatory hurdles, my analysis suggests a fair value price target of $90 for PLTR. While the company’s long-term value proposition remains compelling, these near-term uncertainties temper immediate optimism. Consequently, I assign a “hold” rating. This stance reflects the view that, although Palantir’s innovative technology and market presence are strong, investors should remain cautious until the broader macroeconomic picture stabilizes and the company’s execution against its expansive TAM becomes more predictable.